Kaggle의 'jigsaw-unintended-bias-in-toxicity-classification' 데이터를 이용하였습니다.
▶ pandas 파일 읽기
toxic_train=pd.read_csv(os.path.join(PATH,'train.csv'),
                       #dtype=
                       )
read_csv 함수의 인자로 dtype을 설정해줄 수 있습니다. 따로 설정해주지 않으면 전부 int64, float64로 읽어서 메모리를 너무 많이 차지하는 현상이 발생할 수도 있습니다. 읽은 데이터를 출력해 보면 아래와 같습니다.
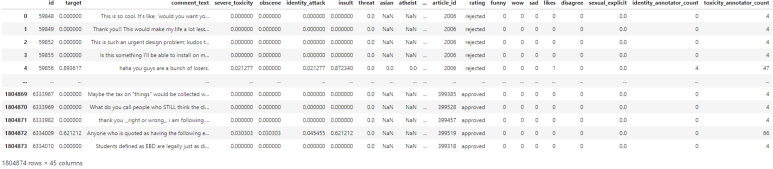
총 1,804,874 개로 이루어져 있으며, 한 행은 45개의 속성으로 이루어져 있습니다. 이 dataframe안의 데이터를 확인하는 방법에는 대표적으로 head와 tail이 있습니다.
▶ head()와 tail()
- head() : dataframe내 처음 n개의 데이터를 출력합니다.(default=5)
- tail() : dataframe내 마지막 n개의 데이터를 출력합니다.(default=5)
toxic_train.head()
# toxic_train.tail()
▶ shape과 info()
- shape : dataframe의 행,열 크기를 출력합니다.
- info() : dataframe의 정보를 출력합니다.
## toxic_train.shape  # (1804874, 45)
toxic_train.info()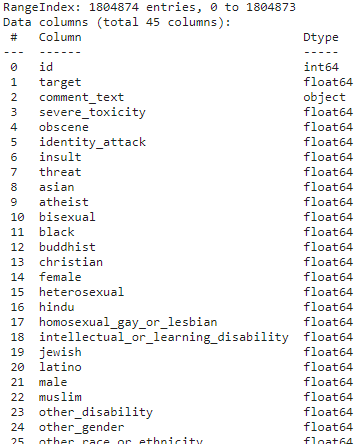
▶ describe()
통계량을 요약하여 출력합니다. 갯수, 평균, 최대값, 최소값 등등을 확인할 수 있습니다.
toxic_train.describe()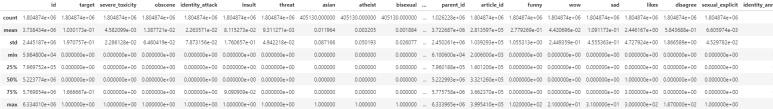
▶ value_counts()
요소의 개수를 카운트 하는 함수입니다.
toxic_train.rating.value_counts()
▶ loc로 데이터 조회하기
toxic_train.loc[toxic_train.female==0.8] ## female의 값이 0.8인 행들을 보여줍니다.

## female의 값이 0.8인 행들의 asian 요소의 값을 보여줍니다.
toxic_train.loc[toxic_train.female==0.8, 'asian']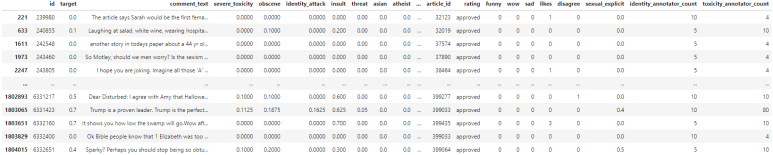
▶ apply()
정의해둔 함수에 따라 전체 데이터 프레임이나 특정 칼럼의 값들을 변경하고자할 때 사용하는 함수입니다. dataframe 타입에 적용할 수 있으며, 복수 개의 칼럼이 필요하다면 apply함수를 사용하는 것이 좋습니다.
print(type(toxic_train)) ## <class 'pandas.core.frame.DataFrame'>
toxic_train.apply(lambda x: x['identity_annotator_count'] + x['toxicity_annotator_count'], axis=1)
'identity_annotator_count' 칼럼과 'toxicity_annotator_count'을 더합니다.

▶ map()
apply 함수처럼 정의해둔 함수에 따라 전체 데이터 프레임이나 특정 칼럼의 값들을 변경하고자할 때 사용하는 함수입니다. 차이점이 있다면 map 함수는 반드시 series 타입에만 적용해야 합니다.
print(type(toxic_train.female)) ## <class 'pandas.core.series.Series'>
## female의 값이 0.8인 값들을 정수형으로 바꾸고 1을 더해줍니다.
toxic_train.female.map(lambda x: int(x==0.8)+1)
loc 함수의 설명에서와 다르게 female의 값이 1씩 늘어난 것을 확일할 수 있습니다.
▶ plot()
데이터를 시각화하여 보여줍니다.
toxic_train.toxicity_annotator_count.plot(kind='kde')
원 그래프, 막대 그래프 등등 다양하게 시각화 할 수 있습니다. plot()함수 안의 kind 변수를 조정해주면 됩니다.
'AI Research > Data Analysis' 카테고리의 다른 글
| [데이터 분석] EDA(Exploratory Data Analysis) (0) | 2023.03.05 |
|---|---|
| [데이터 분석] Feature Engineering (Sklearn) (0) | 2023.03.05 |
| [데이터 분석] Data Preprocessing (Pandas) (0) | 2023.03.05 |